

Your Blood Sugar Lab Panel
The numbers worth knowing and what “optimal” actually looks like.
If you took our blood sugar quiz, this is the panel behind it. Bring it to your next doctor’s visit, or we can order it with you.
The point of the columns is simple: the range printed on your lab results is built to catch disease, and optimal is what we aim for.
The Panel
| Marker | Optimal where we aim |
Suboptimal worth watching |
Standard lab range what most labs call “normal” |
|---|---|---|---|
| Fasting glucose mg/dL |
70–85 | 85–99 | Under 100 |
| Fasting insulin μIU/mL Often left off. Ask for it by name. |
2–6 | 6–25 | Under 25 |
| Fasting glucose mg/dL |
70–85 | 85–99 | Under 100 |
| Hemoglobin A1c % |
4.1–5.3 | 5.4–5.6 | Under 5.7 (5.7–6.4 = pre-diabetes) |
| Triglycerides mg/dL |
70–110 | 110–150 | Under 150 |
| HOMA-IR calculated From fasting glucose and insulin |
Under 1 | 1–2 | Rarely reported |
| Triglyceride : HDL ratio calculated From your standard lipid panel |
Under 2 | 2–3 | Not reported. You calculate it yourself. |
Read across each row: your number, and how far it sits from where we’d want it, not just whether it tripped the lab’s alarm.
Why we ask for fasting insulin
Standard lab ranges aren’t wrong, instead they answer a different question. They’re built to flag disease that needs treatment today, and they’re statistical: normal is defined as wherever most people fall. Unfortunately, most people are drifting toward metabolic trouble, so the bar has quietly widened over time.
For example, a fasting insulin of 18 clears the lab’s bar and still sits well above where you’d feel your best. Your doctor saying normal and us saying let’s tighten this up aren’t in conflict. One is ruling out disease. The other is aiming for how you actually want to feel.
What labs to ask for
- A Comprehensive Metabolic Panel (CMP), which includes fasting glucose.
- Fasting insulin, the one most often skipped. Ask for it by name.
- Hemoglobin A1c.
- A lipid panel, which gives you both triglycerides and HDL.
HOMA-IR and the triglyceride: HDL ratio aren’t separate orders. Both are calculated from the numbers above, so there’s nothing extra to request.
Why we ask for fasting insulin
This is the test most likely to get pushback, so here’s the reasoning behind it.
Insulin resistance develops years before blood sugar rises. When cells stop responding well to insulin, the pancreas compensates by making more of it, and that extra insulin succeeds at holding glucose in the normal range for a long time. Glucose and A1c only move once that compensation starts to fail, which makes them
lagging indicators. Fasting insulin is what’s changing in the meantime.
The Whitehall II study followed 6,538 adults for a median of nearly ten years, and in the 505 who went on to develop type 2 diabetes, insulin sensitivity was already measurably declining several years before diagnosis, while fasting glucose stayed comparatively flat until the final stretch. A normal glucose alongside a high insulin isn’t reassurance. It’s evidence that the compensation is still working.
This is also why HOMA-IR is useful: it reads glucose and insulin together. Someone with a glucose of 95 and an insulin of 18 has two individually unremarkable numbers and a HOMA-IR that clearly is not.
The fair criticism, and our answer to it
The most common objection is that fasting insulin assays aren’t standardized across laboratories, so the same blood can yield different numbers at different labs, and published cutoffs vary by population, age, sex, and assay method. That objection is legitimate. Fasting insulin is not a precision instrument.
Our position is that it doesn’t need to be used for diagnosis to still be useful. Our dietitians use it to assess risk and to watch how labs change over time. With a fasting insulin, we are aiming to prevent medical conditions rather than diagnose or treat them. For that purpose it is genuinely useful, and it is the only marker on this panel that moves early. Ideally, we’re able to use the same lab company each time and interpret the trend rather than any single draw.
Reference: Tabák AG, Jokela M, Akbaraly TN, Brunner EJ, Kivimäki M, Witte DR. Trajectories of glycaemia, insulin sensitivity, and insulin secretion before diagnosis of type 2 diabetes: an analysis from the Whitehall II study. Lancet. 2009;373(9682):2215–21.
Once you have your numbers
Compare them to the columns on page one or use the worksheet at the back. Please keep in mind that a number or two in the suboptimal range isn’t cause for alarm. We are looking for early signs of dysfunction, which is where small diet and lifestyle changes can make a significant impact. If several are drifting, or any markers are clearly elevated, then that’s worth addressing more intentionally.
If your labs and symptoms both point this way
When your numbers and how you feel are telling the same story, a continuous glucose monitor (CGM) can fill in what a single blood draw can’t. Labs give you one moment, but a CGM shows how your blood sugar actually moves in response to your food, your movement, your stress, and your sleep.
A note on CGMs
A CGM is a learning tool, not a grade. The data is there to build awareness and guide supportive changes, not to chase perfect numbers.
We only recommend a CGM alongside professional interpretation. On its own, a stream of numbers without context tends to create anxiety rather than answers, and it’s easy to draw the wrong conclusion from a single spike.
Working with us
f you’d like help getting these labs ordered, understanding what they mean, or building a plan around them, that’s exactly what we do!
Family Nutrition Solutions is a nutrition counseling practice located in Wilmington, NC, and serving clients across North Carolina. We work with adults, children, and whole families. Our approach is root-cause and anti-diet: no restriction plans, no willpower lectures.
- We can order this panel with you and interpret it in the context of your history
- Most visits are covered by major insurance plans (We accept BCBS, Aetna, UHC, and Cigna)
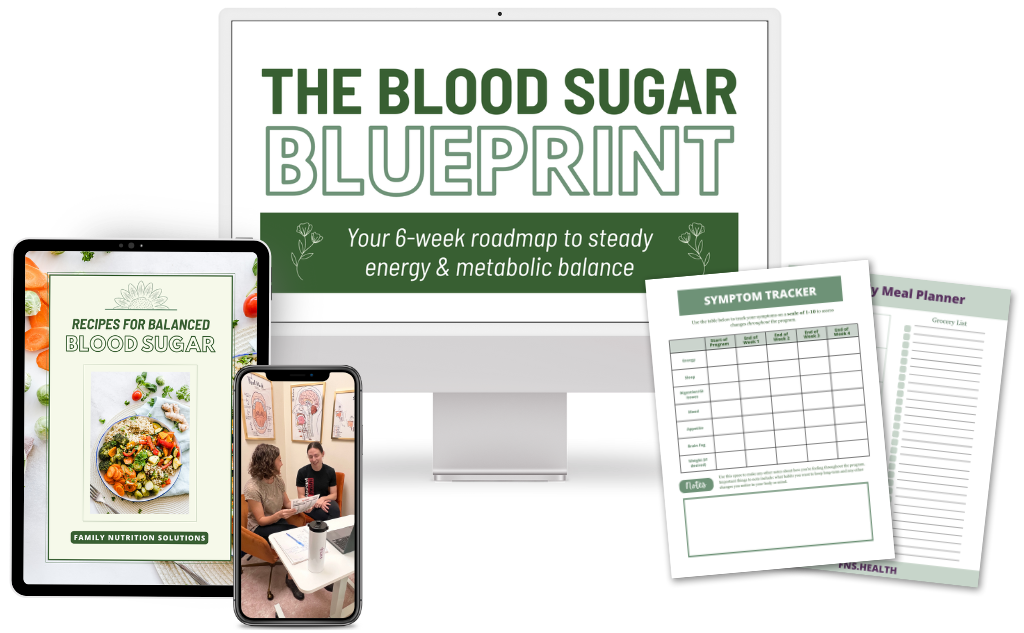
- We offer 1:1 counseling, our signature Blood Sugar Blueprint group program, and free self-paced resources
This handout is an educational screening tool, not a diagnosis or medical advice. Optimal ranges reflect Family Nutrition Solutions’ functional targets and are narrower than standard laboratory reference ranges by design. Always review your results with your physician before making changes to medication, diet, or care.
Your results worksheet
Fill this out when your results come back, and bring it to your next appointment. Recording your own numbers written next to the ranges makes the conversation much easier, whether that’s with your doctor or with us.
| Marker | Optimal | Suboptimal | Your result | Date drawn |
|---|---|---|---|---|
| Fasting glucose mg/dL |
70–85 | 85–99 | ||
| Fasting insulin μIU/mL |
2–6 | 6–25 | ||
| Hemoglobin A1c % |
4.1–5.3 | 5.4–5.6 | ||
| Triglycerides mg/dL |
70–110 | 110–150 | ||
| HOMA-IR calculated |
Under 1 | 1–2 | ||
| Triglyceride : HDL ratio calculated |
Under 2 | 2–3 |
HOMA-IR = (fasting glucose × fasting insulin) ÷ 405. Triglyceride:HDL = triglycerides ÷ HDL. Both use mg/dL.
What Stands Out
Rather than fixating on how many markers are out of range, look at the shape of it. Consider which markers sit outside optimal and by how much.
1) Markers outside my optimal range; 2) Questions I have; 3) How I’ve been feeling lately (symptoms, energy, sleep).